
The following is an article written by Trellance’s Director of Data Science, Collin McCarter. The article originally appeared on CUInsight.com.
Life Stage Marketing can be a key strategy for any credit union looking to improve their member experience and grow the credit union. Implementing Life Stage Marketing allows you to match existing and prospective members with your products and services based on their age and estimated financial needs.
A member’s age is one of the most valuable data points that you possess. Given that everyone must adhere to the rules of aging and time, a member’s age can be incredibly predictive of their financial needs. Even more exciting is the ability to enrich your data with 3rd party data. Enriching your data with the 3rd party demographic data allows you to better identify opportunities and to improve targeted communications to your existing and prospective members. This drives better results at a lower cost.
By identifying and promoting your solutions for every life stage it will help you diversify the age of your member base to ensure the long term stability and growth of your credit union. Using life stages, you can proactively provide relevant product suggestions instead of reacting when a life event occurs. A focus on life stages will always be useful in financial services marketing because of common and expensive life events such as attending college, owning a car, owning a home, medical emergencies, retirement, estate planning, etc.
Looking to public research, the Federal Reserve Bank of St. Louis published a working paper theorizing that individuals attempt to “smooth” patterns of lifetime income and consumption by using financial products for saving and borrowing. The author describes these stages as: “Most people’s lifetime income follows a hump-shaped pattern: Income is lower when they are young, income rises (and peaks) during middle age, and income falls again during retirement. If consumption matched income, then consumption would have a hump shape as well. That is, people would consume few goods and services when they are young, consume a great deal when middle aged, and again consume very little after they retire. However, most people prefer a smoother consumption pattern over their lives.”
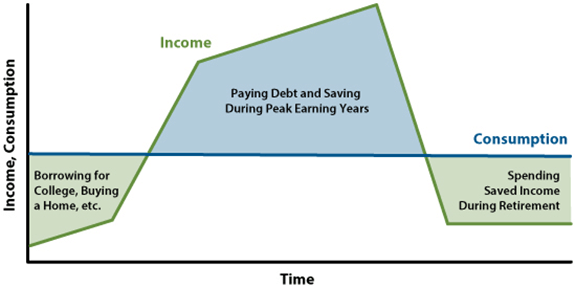
Source: Wolla, Scott. Federal Reserve Bank of St. Louis. Nov 2014. “Smoothing the Path: Balancing Debt, Income, and Saving for the Future”
Using the three primary life stages from the Federal Reserve, one could also match financial products to life stages as seen below. You
| Products | Young Adult | Middle Aged | Retired |
| Payments |
|
|
|
| Savings |
|
|
|
| Borrowing |
|
|
|
After laying a foundation for the value of life stage marketing and a brief introduction to how demand for financial products changes over the lifecycle, these theories can typically be tested at a national level with public data. See the below table for average US household financial and income statements by age of householder as published by the Federal Reserve’s Survey of Consumer Finances and the Bureau of Labor Statistics Consumer Expenditure Survey.

Figure 2: Average US Households by Age of Householder
As with any data source, caution must be had when interpreting insights across geographies, time periods, survey samples, etc., but there is significant value from tables like this when delivering marketing analytics use cases such as “share of wallet”, “member personas”, and “targeted marketing”.
Beyond this table on average US households, both public data sources and many other data providers include additional granularity by geography or topic, regular data product updates, and free learning resources with support representatives.
If you’re interested in learning more about public data, targeted marketing, or “Life Stage Marketing” at Trellance, please reach out to us with questions!

Extra Reading!
BLS Data on Engaging Data – https://engaging-data.com/household-spending-income/
Nielsen PRIZM Lifestage Groups – https://guides.ucf.edu/c.php?g=78912&p=519017